想要快速上手可以參考這篇官方文檔
https://leafletjs.com/examples/quick-start/
想要快速開發所以用 codepen 寫 搭配 vue.js,採用 cdn 的方式引入 js & css
起手式先在 HTML 裡面新增一個#map,js 的部分先建立 map 容器設置地圖初始的中心點以及縮放倍率
1
2
3
4
5
6
| this.map = L.map("map", {
center: [25.033976, 121.5623609],
zoom: 16,
});
var myMap = L.map("map").setView([25.033976, 121.5623609], 16);
|
接下來設置地圖底圖
1
2
3
| L.tileLayer("https://{s}.tile.openstreetmap.org/{z}/{x}/{y}.png", {
attribution: "© <a href=”https://www.openstreetmap.org/copyright">OpenStreetMap</a> contributors’
}).addTo(this.map);
|
- {z} 圖磚 zoom 層級
- {x} 圖磚 x 座標
- {y} 圖磚的 y 座標
設定 opentopomap 為圖磚,也可以選擇 googleMap,但是要收費
然後我滿心歡喜的期待我可以在畫面上看到載入的地圖,但是報告長官…沒有畫面,反覆測試之後,終於發現原因!因為我要用 vue 開發,為了綁定 vue 作用域,新增一個#app,接著把#map 放進#app 裡面,然後地圖就消失了!!??
google 一下發現蠻多人遇到這問題,解決方法就是一定要幫父容器設置高度 不然地圖會出不來
因為沒用過 fetch 順便練習一下用 fetch 接 api,送出後成功會獲得一個 promise 物件,這時候可以用 json()處理 response,再丟給下一層處理。
先看一下 fetch 的基本用法
1
2
3
4
5
6
7
8
9
10
| fetch(網址)
.then(res => {
return res.json();
}).then(result => {
})catch((err) => {
console.log(‘錯誤:’, err);
});
|
正式實作
1
2
3
4
5
6
7
8
9
10
11
12
13
14
15
16
17
18
19
20
21
22
23
24
25
26
27
28
29
30
31
32
33
34
35
36
37
| getMaskData(){
this.loading = true
fetch(this.url).then((response)=>{
return response.json()
}).then((jsonData)=>{
this.loading = false
console.log(‘jsonData’,jsonData)
this.dataList = jsonData
this.setMark()
})
},
createMark(){
this.greenMark = new L.Icon({
iconUrl: 'https://cdn.rawgit.com/pointhi/leaflet-color-markers/master/img/marker-icon-2x-green.png',
shadowUrl: 'https://cdnjs.cloudflare.com/ajax/libs/leaflet/0.7.7/images/marker-shadow.png',
iconSize: [25, 41],
iconAnchor: [12, 41],
popupAnchor: [1, -34],
shadowSize: [41, 41]
})
this.redMark = new L.Icon({
iconUrl: 'https://cdn.rawgit.com/pointhi/leaflet-color-markers/master/img/marker-icon-2x-red.png',
shadowUrl: 'https://cdnjs.cloudflare.com/ajax/libs/leaflet/0.7.7/images/marker-shadow.png',
iconSize: [25, 41],
iconAnchor: [12, 41],
popupAnchor: [1, -34],
shadowSize: [41, 41]
});
|
詳細用法可參考下列網址
https://github.com/pointhi/leaflet-color-markers
如果一次在畫面上繪製數千筆資料,對瀏覽器肯定是一大負擔,因此採用了 MarkerClusterGroup 的套件,在地圖可視範圍內才繪製 mark,也是需要引用對應的 css& js
1
| this.markLayer = new L.MarkerClusterGroup().addTo(this.map);
|
接下來獲取 api 給的資料,逐一繪出畫面上所有藥局的位置圖標為了搭配資料篩選,預設參數為空陣列時就會顯示所有資料
1
2
3
4
5
6
7
8
9
10
11
12
13
14
15
16
17
18
19
20
21
22
23
|
setMark(arr = []) {
let data = arr.length == 0 ? this.dataList[‘features’] : arr
this.showList = data
this.dataList[‘features’].forEach((item) => {
let [x, y] = item.geometry.coordinates
let {
name,
updated,
custom_note,
mask_adult,
mask_child
} = item.properties
let marks = item.properties.mask_adult == 0 ? this.redMark : this.greenMark
this.markLayer.addLayer(L.marker([y, x], {
icon: marks
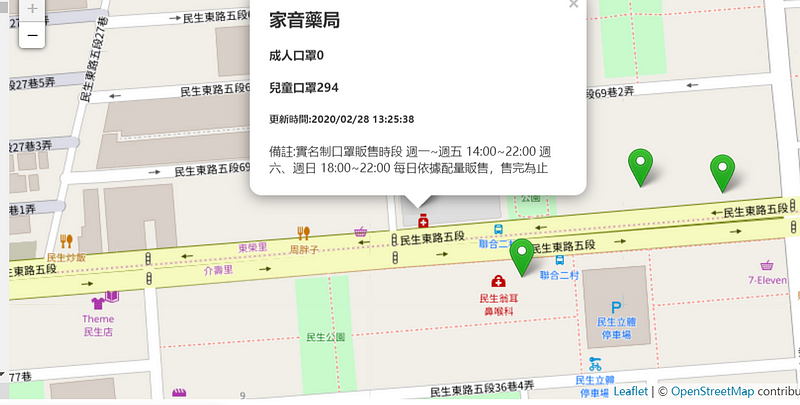
}).bindPopup(`<h2>${name}</h2>
<h4>成人口罩${mask_adult}</h4><h4>兒童口罩${mask_child}</h4><h5>更新時間:${updated}</h5><p>備註:${custom_note}</p>
`))
})
this.map.addLayer(this.markLayer)
}
|
抓今日時間的方式為了快速用了
new Date().toLocaleString()
篩選資料的方式 目前只用縣市來做比對
1
2
3
4
5
6
7
8
| filterData(event){
let target = event.target.value
let arr = this.dataList["features"].filter((item)=>{
return item.properties.county == target
})
this.setMark(arr)
}
|
為了效能問題 ,每次繪製新的 mark 前都要先清空 mark 圖層
1
2
3
4
5
6
7
8
| cleanMarker(){
this.map.eachLayer((layer)=>{
if(layer instanceof L.Marker){
this.map.removeLayer(layer)
}
})
}
|
附上 codepen 網址
請無視被我放生的 css…
codepen